What's New in Version 2.0
Sound Insulation Testing Processing
One of the main new features to be added into Sound Design is the ability to process sound insulation testing data. Import your test data, choose which standards to follow, select the test files and export results graphs straight to PDF.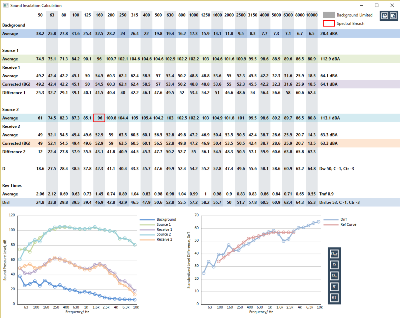
Store Test Results To Your Company Database
Once you've processed your results, you can store all the data in your company's database. This makes it easy to view all tests undertaken by the company, as well as the test details, such as who undertook the tests and when.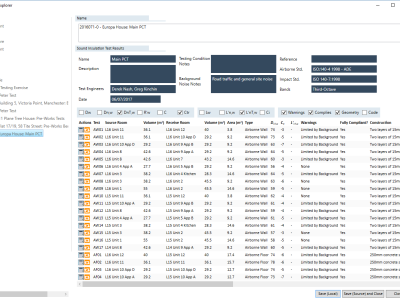
Drag and Drop Construction Builder
There is the option to tag all of your test results with a construction code which can be built up with our new drag and drop construction builder. Graphics of your construction can also be added to your print objects.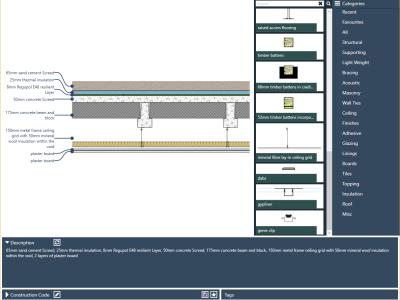
Smart Interrogation of Test Data
Coding your test elements with a construction code allows Sound Design to carry out smarter interrogation of your database. So you could search for the results of all tests where the separating elements included 2 layers of any type of plasterboard each side of any type of structural frame for example, and compare the results.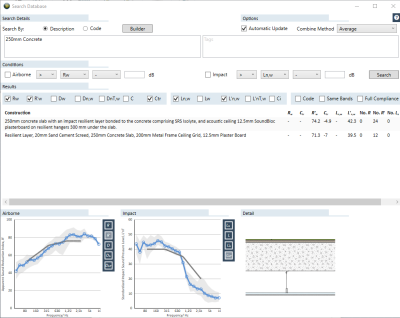
Highlight Canvas Regions
The Note component now allows you to drag a coloured highlighter over a specific area of the canvas. If you want to visually group a specific set of modules on the canvas, this is the perfect way.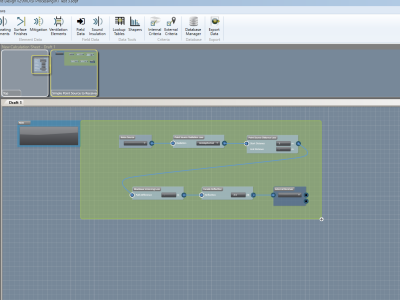
Notes with Hyperlinks
Each data item now contains a Notes box. The box will recognise web links, links to local files, and links to local directories, and automatically turn these into clickable hyperlinks for you.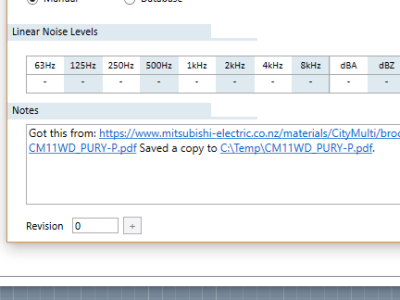
Spreadsheet Notes
You can now write notes on any module which will also appear on any spreadsheets incorporating that module. These can also be overwritten on a spreadsheet by spreadsheet basis, which could be useful when reviewing calculations, for example.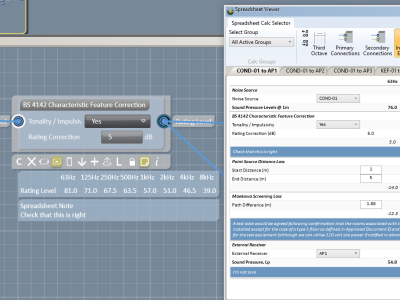
Is Null Component
A new addition to the Logic toolbox, the Is Null component allows you to deal with null inputs without stopping your calculation. So if, for example you have a mitigation measure in your calc chain by no silencer selected, you can use the Is Null component to set the insertion losses to 0 and continue with the rest of the calc.
Type to Auto Component
A new addition to the Flow Control toolbox, the new Type to Auto component allows you to send any data type (i.e. single figure, octave or third-octave) into a container, do something with it and send it back out again. This means single containers can now be created to deal with all data types, rather than one for single figures, one for octave bands etc.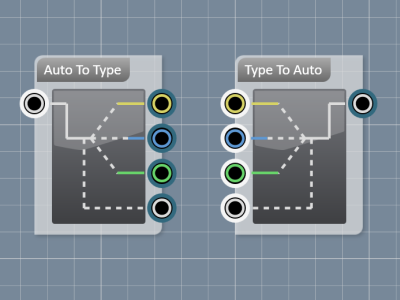
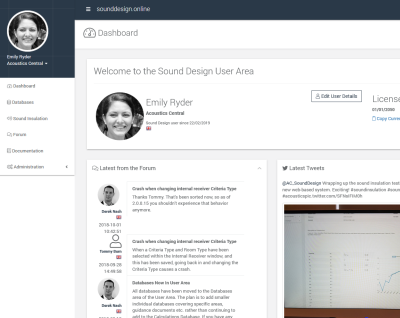
Online User Area
The Sound Design User Area provides online supporting services for Sound Design. If you’re a user, you can get access to your license code at any time, download resource database files, look at the help documentation, or post questions in the forum. You can also use your User Area login details in Sound Design, meaning you will never need to enter license codes again! Administrators can manage users and license renewals from within the Administration section of the User Area.The User Area also allows you to view any sound insulation testing data you’ve uploaded to the server, as well as getting links to send to Clients so they too can view the test data.
As well as a load of other features, like:
Print-Time Content
•Text and images on print objects can now be requested at print time - useful for things like adding signatures or custom fields.
Translation from various Sound Level Meters
•We've included the ability to import data from a number of sound level meters where the data is stored or easily converted into an open format, like TXT, CSV or XLSX. If you've got a sound level meter you believe could be included, just get in touch and we'll look at adding in a specific translation protocol for your meter.
Criteria Exceeders Highlighted
•Internal or External Receivers exceeding their criteria will now be highlighted red in the Internal or External Receivers list.
Items from Project to Database
•Data items used in your projects can now be saved directly to your database for future use.
Program Efficiencies
•A number of efficiencies have been made in the main calculation algorithm, as well as plugging of memory leaks. There should be a noticeable decrease in calculation time of complex chains, as well as reduced memory footprint through the life of program execution.
Separating Element Lab / Site Data Distinction
•The distinction between laboratory and site data for separating elements has been made throughout the program.
Tab Through Container Interactive Elements
•You can now tab through the interactive elements (i.e. drop down boxes and text boxes) on containers
Import Airborne and Impact Separating Element Data
•You can now import airborne and impact sound insulation data into your database and project files.
Canvas to PDF
•You can export the canvas to a PDF document, should you wish to refer to it at any point without opening Sound Design.
Vector Graphics on Print Objects
•Sound Design now supports SVG files on your print objects, meaning graphics like your company logo no longer need to be in bitmap form (like PNG or JPG)
Graph Values on Mouse Over
•Putting your mouse over any of the graphs in the program will now show you the numerical value.
Metric or Imperial Units
•You can now use metric or imperial units when working with lengths, areas, densities etc.
What's New in Version 1.5
Show Node Values on Canvas
You can now look at the values at the output nodes of a single module by selecting it with the mouse, or all modules on the canvas by pressing F10. You can also select a variety of single-figures to be shown if you’re vieweing octave or third-octave data.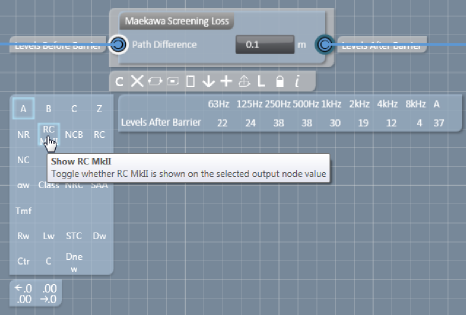
Chain Select
Version 1.5 provides a much simpler, more intuitive method of selecting the parts of your assessments you want to view as spreadsheets, print, and export to a .xlsx file.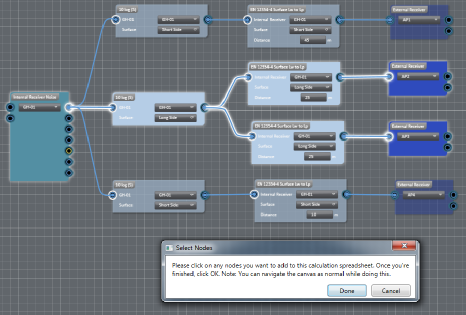
Interactive Spreadsheet Viewer
The spreadsheet viewer has been completely rebuilt in version 1.5. It is now interactive, meaning that you can modify your assessments using the spreadsheet viewer as well as on the canvas. Single figures (e.g. dBA, NR, Rw etc.) can be added with a couple of mouse clicks. Also other options like the number of decimal places shown can also easily be changed. Spreadsheet views are also saved within containers, and automatically reloaded when the host container is added to the canvas.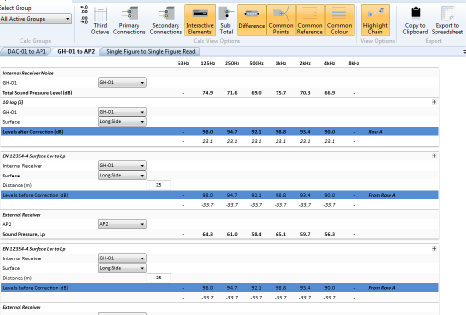
Logic Toolbox
You can now easily build-up equations with the most complicated conditions using the new logic toolbox components. The Logic Toolbox contains all the usual logic functions (AND, OR, etc.), as well as a new if-then-else component that adds new nodes everytime you connect an input to it, allowing you to evaluate as many conditions as you like.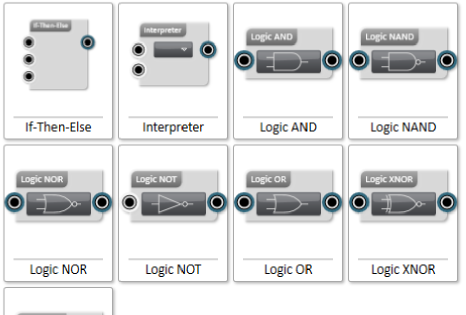
Other features
- Paste clipboard data directly from excel into the canvas components and data dialogs
- Export all calcs to a single .xlsx file
- Receive alerts when a database you’re using has been updated by someone else
- Much more efficient saving and loading, both in terms of file size and loading/ saving times
- Projects auto-saved every 5 minutes to a back-up file which can be recalled in the event of a crash
- Containers are prevented from going beyond the bounds of the canvas when exploded
- Selecting based on direction
- General bug fixes and improvements.